
Solar Curtailment Problem: Why Renewable Energy Is Being Wasted in 2026
- Green Fuel Journal

- Apr 8
- 30 min read
Causes, Impact & Solutions — A Research-Backed Analysis by the GreenFuelJournal.com Research Team
In the spring of 2025, operators at India's National Load Dispatch Centre faced a situation that would have been unimaginable a decade ago: they were being forced to switch off working solar panels, panels generating clean, free-fuel electricity, because the grid simply could not absorb it. Over that single year, India lost 2.3 terawatt-hours (TWh) of solar generation to solar curtailment, according to a January 2026 report by energy think tank Ember.

That figure is roughly equivalent to the annual electricity consumption of 400,000 Indian households. Meanwhile, on the other side of the world, California's CAISO grid curtailed 3.4 million MWh of wind and solar in 2024 alone — a 29% jump from the year before, according to the U.S. Energy Information Administration (EIA).
This is the curtailment paradox. Countries are spending hundreds of billions of dollars building clean energy infrastructure, then deliberately throwing away the electricity it produces. The problem is not going away. The International Energy Agency (IEA) confirmed in its Renewables 2025 report that curtailment levels have been rising in markets including China, Germany, Brazil, Chile, the United Kingdom, and Ireland.
The number of hours with negative electricity prices — a direct consequence of solar oversupply — has surged across multiple countries, coinciding with peak solar generation hours.
This analysis examines why solar curtailment is happening, how much clean energy is being lost, what it costs the economy and the clean energy transition, and — critically — what works when it comes to fixing it.

What Is Solar Curtailment?
Solar curtailment is the deliberate reduction or shutdown of solar power output even when sunlight is available and panels are capable of generating electricity. Grid operators order curtailments when the power system cannot safely absorb more electricity — typically due to grid congestion, oversupply, or the physical limits of transmission lines. The result: clean energy that could have displaced fossil fuels is simply discarded.
The term comes from the Latin curtare — to shorten. In energy systems, it refers specifically to the act of reducing a power plant's output below its potential, by instruction, not by fault. For solar plants, this most often happens when midday generation peaks, demand is low, transmission lines are full, and inflexible baseload generators (coal, nuclear) cannot ramp down fast enough to make room.
It is important to distinguish between two types of curtailment currently playing out in markets like India. Transmission-constrained curtailment happens when physical grid lines between generation zones and demand centers lack capacity — the electrons simply cannot travel far enough.
Emergency or grid-security curtailment occurs even when transmission is available, because the system lacks sufficient flexibility to handle rapid swings in net load. Both are growing, and both are expensive.
Curtailment is distinct from negative electricity pricing, though the two are closely linked. When solar output floods the market faster than demand can absorb it, wholesale electricity prices fall to zero, then go negative — generators must actually pay for the privilege of injecting power.
Germany recorded 457 hours of negative electricity prices in 2024, according to Germany's Federal Network Agency (Bundesnetzagentur), almost entirely coinciding with peak solar generation hours. This is not a theoretical edge case; it is now a structural feature of grid operations in high-solar markets.
Why Is Solar Curtailment Increasing Globally?
Solar curtailment is increasing globally because solar PV deployment is outpacing grid infrastructure, storage capacity, and demand-side flexibility. Solar now accounts for nearly 80% of worldwide renewable electricity capacity expansion through 2030 (IEA, 2025). Grids built for predictable, dispatchable power from coal and gas are structurally unable to absorb electricity that peaks sharply at midday and disappears at sunset.
The numbers are frankly staggering. In 2024, the world added over 600 GW of new solar capacity — more than double the 242 GW added in 2022, according to IEA-PVPS data. China alone installed 357 GW in that single year, pushing its cumulative solar capacity past 1 terawatt (TW). India added 38 GW in 2025, a national record, taking its total installed solar capacity to roughly 136 GW. Global cumulative solar capacity crossed 2.2 TW at the end of 2024.
The IEA projects solar will account for over 60% of all new global electricity generation capacity between now and 2030. That expansion is not inherently a problem. The problem is that it is happening faster than the grid can adapt. Transmission lines take 7 to 15 years to permit and build in many countries. Battery storage, though growing rapidly, is still a fraction of what is needed. And coal plants — which provide the baseload reliability grids depend on — cannot ramp down fast enough during sunny midday hours to give solar room to operate.
The IEA noted in Renewables 2025 that China's solar curtailment rate rose roughly 55% in 2024. Globally, renewable curtailment volumes increased roughly 55% in 2024, reaching 4.1% for wind and 3.2% for solar PV. The IEA expects these rates to stabilize — but only if HVDC transmission, battery storage, and market reforms advance at pace. Without those, curtailment will keep climbing.
There is also an economic self-reinforcing loop at work. When curtailment becomes chronic and unpredictable, investors lose confidence. Projects built on Power Purchase Agreements (PPAs) that assumed a certain revenue from electricity sales suddenly underperform. The PPA valuation and risk management market — worth USD 2.4 billion in 2025 — is growing precisely because curtailment risk has become a material investment variable. Corporate PPA volumes fell 10% in 2025 partly because of increasing negative power prices in European markets, according to BloombergNEF.
What Causes the Solar Curtailment Problem in Renewable Energy Systems?
Curtailment does not have a single cause. It is better understood as the output of a system designed for an older era of electricity generation, now being asked to handle a fundamentally different one. Three structural factors dominate.
Grid Congestion & Infrastructure Lags
Grid congestion is the most common cause of solar curtailment. It occurs when transmission lines between generation zones and consumption centers reach their physical capacity limits. Power cannot flow faster than physics allows. In the EIA's analysis of CAISO, congestion-related curtailments increased significantly from 2019 because solar generation was outpacing transmission upgrades. The IEA estimates the world needs to add 25 million kilometres of new grid infrastructure by 2030 to keep pace with renewable deployment.
The core problem is a timing mismatch between technology cycles. Solar panels can be manufactured and installed in six to eighteen months. Transmission infrastructure — towers, conductors, substations, control systems — typically requires a decade or more to plan, permit, finance, and build.
In Germany, the north-south high-voltage transmission corridor needed to carry offshore wind power from the North Sea to Bavaria's industrial demand centers has faced years of legal challenges and local opposition.
In India, renewable-rich states like Rajasthan and Gujarat generate far more solar than local demand can absorb, but the interstate transmission network lacks the capacity to move that power east toward demand centers like Maharashtra.
The EIA noted that from 2014 to 2024, California's wind and solar capacity grew from 9.7 GW to 28.2 GW — a nearly threefold increase. Transmission upgrades during that period were nowhere near proportional.
California's CAISO is now pursuing 45 transmission projects from its 2022–23 planning process, but the work is necessarily lagged. In resource-rich western provinces of China — such as Gansu, Xinjiang, and Inner Mongolia, where over 30% of electricity now comes from variable wind and solar — transmission to eastern demand centers remains the critical bottleneck.
Oversupply vs. Demand Mismatch
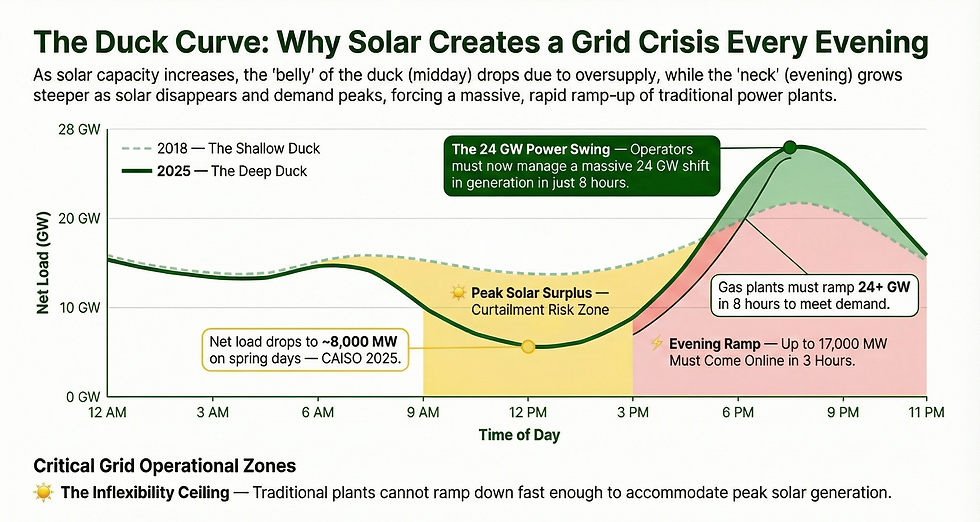
Even when transmission lines are available, the sheer volume of solar generation during midday hours can overwhelm total electricity demand. This is the Duck Curve problem, first identified by researchers at the National Renewable Energy Laboratory (NREL) in 2008 and named by CAISO in 2012–2013. The duck curve plots net load — total electricity demand minus renewable generation — over a 24-hour period.
As solar capacity grows, the net load dips sharply from approximately 10 AM to 3 PM, creating the duck's belly. Then, as the sun sets and demand rises for evening cooking, lighting, and air conditioning, net load surges again — forming the duck's neck.
In California, the average April day in 2025 saw net load swing by more than 24 GW in just 8 hours. On the lowest net-load day in spring, grid operators observed net load levels drop as low as 8,000 MW at midday — levels that require curtailing solar simply to keep enough thermal generation spinning to handle the evening ramp. CAISO has seen total load valleys deepen by over 13.6 GW between 2018 and 2025.
In India, the demand mismatch problem took a particularly stark form in October 2025. Due to exceptionally mild temperatures that autumn, daytime electricity demand fell well below forecast levels, even as India's massive solar fleet continued generating at full capacity. On some days, the solar curtailment rate rose to 12% of total solar generation, according to Bloomberg data.
On the worst days, approximately 40% of solar output was denied access to the grid. The National Load Dispatch Centre had run out of options: coal plants were already at minimum technical output, demand would not budge, and battery storage capacity was insufficient to absorb the surplus.
The Inflexibility of Baseload Power (Coal/Nuclear)
Coal and nuclear plants share a fundamental characteristic that makes them poor partners for solar power: they cannot change output quickly. A large coal unit at minimum technical load might still be generating at 40–60% of its rated capacity. It cannot simply switch off for four hours and restart. The startup cycles are expensive — cold starts on large coal units can cost tens of thousands of dollars and take 6–12 hours — and the mechanical stress of repeated cycling shortens plant lifetimes.
In India, the coal fleet's minimum technical load threshold was documented at 55% of rated capacity. That means even when the system operator desperately needed thermal output to fall further to accommodate peak midday solar, coal simply could not go lower. The technical floor of coal generation created a ceiling on how much solar could operate. Ember's January 2026 report confirmed this mechanism was the primary driver of India's emergency curtailment in 2025.
In Germany, a prolonged high-wind event in December 2024 led to excessive offshore wind generation that overwhelmed transmission infrastructure. Re-dispatch measures involving offshore wind increased from 1,504 GWh to 1,812 GWh year-on-year in Q4 2024, while the use of network reserve power plants surged from 291 GWh to 797 GWh. The total cost of Germany's grid congestion management that year came to 2.776 billion euros, even after falling 17% from 2022's record levels, according to the Bundesnetzagentur.
How Much Solar Energy Is Being Wasted? Data & Case Studies
Globally, hundreds of TWh of solar energy are wasted annually through curtailment. India alone lost 2.3 TWh in 2025 (Ember). California's CAISO wasted 3.4 million MWh in 2024 (EIA). Germany curtailed 1,389 GWh of solar in 2024 — a 97% year-on-year increase (Bundesnetzagentur).
China, despite aggressive grid investment, maintained a solar curtailment rate of 3.2% in 2024 (NEA), equivalent to tens of TWh at China's scale. In Chile, curtailment cost 6 TWh of renewable output in 2024, cutting the country's theoretical PV penetration rate by 3.3% (IEA-PVPS).
Country / Region | Curtailment Volume | Period | Curtailment Rate | Key Driver | Economic Cost |
🇮🇳 India | 2.3 TWh (emergency only) | May–Dec 2025 | ~18% of monthly avg. solar | Coal inflexibility, low demand, transmission | USD 63–76 million in compensation |
🇺🇸 California (CAISO) | 3.4 million MWh (3.4 TWh) | Full year 2024 | Solar = 93% of curtailed MWh | Duck Curve, congestion, spring oversupply | ~$270M+ in lost generator revenue |
🇩🇪 Germany | 1,389 GWh solar + 19 TWh total RE | Full year 2024 | 3.5% of total renewable generation | Grid congestion, high PV radiation, N-S gap | €2.776 billion (total grid mgmt.) |
🇨🇳 China | ~26–28 TWh (est.) | Full year 2024 | 3.2% solar; 4.1% wind | West-East transmission bottleneck, local demand lag | Rising; specific figures vary by province |
🇨🇱 Chile | 6 TWh renewable | Full year 2024 | 3.3% reduction in PV penetration rate | PPA-driven oversupply, grid limits | Project cancellations reported |
🇬🇧 UK & 🇮🇪 Ireland | 5–15% (range) | Recent years (IEA 2024) | 5–15% of wind/solar output | Transmission constraints, island grid limits | Constraint payments to generators |
Sources: Ember (Jan 2026), EIA (May 2025), Bundesnetzagentur (Apr 2025), IEA Renewables 2024 & 2025, IEA-PVPS Snapshot 2025. India figure covers emergency/grid-security curtailment only; transmission-constrained curtailment is separately larger.

India: The 2025 Stress Test
India's curtailment story in 2025 is instructive precisely because it was not driven by excess renewable capacity — it was driven by insufficient flexibility. The country added a national record 38 GW of solar in 2025, pushing cumulative installed solar capacity to approximately 136 GW. India achieved 50% non-fossil fuel-based power generation that year, a historic milestone. Yet the same grid that achieved this milestone was repeatedly unable to absorb midday solar output.
The mechanism, as Ember described it, was straightforward but telling. The National Load Dispatch Centre could not reduce thermal generation below minimum technical limits. On days when temperatures were mild — particularly through October 2025 — electricity demand during midday hours fell well below the system's minimum generation floor. Something had to give. That something was solar. India's coal fleet, which still supplied roughly 75% of power generation in 2024, functioned as a structural ceiling on solar absorption capacity.
The financial compensation paid to affected solar generators for emergency curtailment came to between INR 5,750 million and INR 6,900 million — approximately USD 63–76 million. These costs were socialized across the power system, ultimately landing in consumers' electricity bills. The curtailed solar energy could also have avoided approximately 2.1 million tonnes of CO₂ emissions, had it displaced coal generation.
Ember analyst Ruchita Shah put it plainly: "Clean energy cannot scale efficiently without flexibility." She also noted that India's experience in 2025 served as an early stress test for a high-solar future, rather than evidence of excess renewable capacity.
California: The Duck Curve Deepens
California has been grappling with the curtailment problem longer than almost any other jurisdiction. CAISO first articulated the Duck Curve challenge in 2013. By 2020, the grid was already curtailing 1.5 million MWh of solar per year. By 2024, that figure had more than doubled to 3.4 million MWh — a 29% increase from 2023 alone.
Spring remains the worst season, for a straightforward reason: solar irradiance is high, temperatures are moderate, and neither air conditioning nor space heating is driving significant electricity demand. On an average April 2025 day, CAISO's net load curve required grid operators to manage a swing of over 24 GW within 8 hours. The evening ramp — the duck's neck — requires up to 17,000 MW of generation to come online within just 3 hours, primarily from natural gas peaker plants.
Battery storage has been making a real difference. CAISO's battery capacity jumped 45% in 2024 alone, from 8.0 GW to 11.6 GW. By early 2025, it had climbed past 13 GW. During April 2025, batteries absorbed excess midday solar that would otherwise have required curtailment, then discharged that energy during the evening peak. The Western Energy Imbalance Market (WEIM) also helped: in 2024, more than 274,000 MWh of curtailments were avoided through intra-day trading with neighboring grid operators, equivalent to roughly 8% of what would otherwise have been curtailed.
Even with these tools in place, CAISO curtailed more than 738,000 MWh in just the first four months of 2025. 93% of all curtailed energy in CAISO during 2024 was solar — the renewable that faces the sharpest timing mismatch between peak generation and peak demand.
Germany: The North-South Divide
Germany's curtailment problem has a geographic dimension that makes it structurally harder to solve than California's. The country's offshore and onshore wind resources are concentrated in the north and northeast, while industrial electricity demand is concentrated in the south and west. The high-voltage transmission corridor needed to bridge this divide remains years behind schedule.
Solar curtailment in Germany nearly doubled in 2024, rising 97% year-on-year to 1,389 GWh, according to the Bundesnetzagentur. Germany's Federal Network Agency attributed the spike to two factors: the rapid expansion of installed PV capacity and an unusually high number of sunshine hours during summer 2024. Solar now accounts for 14.7% of Germany's net electricity generation, generating 63.3 TWh in 2024, up from 55.7 TWh in 2023.
Germany recorded 457 hours of negative electricity prices in 2024 — up from 301 hours in 2023. Under the country's Renewable Energy Act (EEG), solar operators had historically still received feed-in tariffs even during negative pricing hours.
In February 2025, Germany passed a new law ending this compensation for new solar installations during periods of negative pricing, and capping feed-in to the grid at 60% of generation capacity unless a smart meter is installed. This is a significant policy shift — it forces solar operators to invest in storage or demand response rather than simply dumping surplus power into the grid.
The total cost of Germany's grid congestion management in 2024 came to €2.776 billion, though this represented a 17% fall from 2022's record figure of €4.2 billion, largely because wholesale electricity prices were lower, reducing compensation payments to curtailed operators.
China: Scale Beyond Measure
China's curtailment story operates at a scale that is difficult to fully appreciate. The country installed 277 GW of new solar capacity in 2024 alone — more than double the entire cumulative installed capacity of the United States at the end of that year. China's total solar capacity reached 887 GW at end-2024. It has since crossed 1 TW.
Despite the largest grid investment program in human history — including an RMB 608 billion (USD 84.7 billion) investment in grid transmission and modernization in 2024 — curtailment has been creeping back up after a decade of improvements. China's solar curtailment rate reached 3.2% in 2024, with wind at 4.1%, according to the National Energy Administration (NEA).
In resource-rich provinces like Gansu, where over 30% of electricity is now generated from variable sources, integration challenges are acute. The NEA raised the allowed provincial curtailment threshold from 5% to 10% in June 2024, a pragmatic acknowledgment that curtailment cannot be eliminated in high-penetration provinces while grid expansion continues.
China's PV generation reached 834.1 TWh in 2024, representing 8% of total electricity consumption — an astonishing figure for a country that added virtually no solar just fifteen years ago. At a 3.2% curtailment rate, that implies roughly 26–28 TWh of solar energy wasted in 2024 — more than the entire solar generation of Germany.
What Is the Economic Impact of Solar Curtailment?
Solar curtailment reduces renewable energy project revenues by 15–25% in chronic cases, compromises debt service coverage ratios, increases the effective Levelized Cost of Energy (LCOE), and deter future clean energy investment. A 100 MW solar farm experiencing 10% annual curtailment can lose USD 2–4 million in revenue. Negative electricity pricing — directly linked to solar oversupply — has caused corporate PPA deal volumes to fall 10% in 2025 as buyers price in curtailment risk.
The economic effects of curtailment ripple far beyond the immediate loss of electricity generation revenue. Consider the chain of consequences. When a solar generator is curtailed, it receives either nothing (in transmission-constrained curtailment cases in India, where compensation is not guaranteed) or a reduced payment through an ancillary services mechanism. Ember estimated that India's emergency TRAS curtailment payments in 2025 came to USD 63–76 million — costs that were ultimately socialized into consumer tariffs.
For project finance, curtailment is especially damaging. Utility-scale solar PV projects are capital-intensive, long-dated investments. Their financial viability typically rests on a Power Purchase Agreement (PPA) — a long-term contract guaranteeing a fixed or indexed price for electricity output over a specified period.
When curtailment reduces actual generation below contracted forecasts, it directly impairs the Debt Service Coverage Ratio (DSCR) — the metric lenders use to assess whether cash flows are sufficient to service debt. A project designed with a DSCR of 1.3x suddenly performing at 1.05x because of chronic curtailment faces refinancing risk and potential covenant breaches.
A 2025 study published in ScienceDirect quantified curtailment economics in Spain over October 2022 to September 2024: 2.5% of PV-generated energy was curtailed without compensation, leading to a loss of €146,400 per day, an increase in LCOE by 0.10 €cent/kWh (+2.5%), and a decrease in Net Present Value of €27.1/kW (−7.7%). These numbers appear small in isolation but compound significantly across the project lifetime and across thousands of projects.
In Germany, renewable curtailment cost €554 million in 2024, even after a decline in total curtailed volume. Germany passed legislation in 2025 that ends compensation for new solar installations during negative pricing hours, effectively shifting financial risk from the system to developers — which in turn creates pressure to co-locate storage.
Negative electricity pricing represents a secondary but growing economic harm. When wholesale prices go negative, generators are paying to put electricity onto the market — an economically irrational situation that signals structural oversupply. Corporate PPAs are being impacted. BloombergNEF reported that European utilities' share in PPA signing fell sharply between 2023 and 2024, with Pexapark data showing a 59% drop in utility-signed PPAs across that period. One of the reasons cited: utilities had already "maxed out on solar risk" and were anticipating more curtailment. Corporate PPA volumes fell 10% in 2025, with negative power prices in Western Europe cited as a key headwind.
"We think we're entering a world now where the value of renewables is set by the value of renewables and BESS themselves, not just based on the gas price."— Itamar Orlandi, Pexapark (pv magazine, 2025)
For investors, the curtailment risk premium is now priced into project finance. Battery Energy Storage Systems (BESS) co-located with solar PV have moved from optional add-ons to near-standard project features, particularly in markets where curtailment exposure is material. Industry data from 2023 showed approximately 26% of utility-scale PV capacity was already configured as a hybrid PV/BESS system. That proportion is rising sharply. Hybrid projects generally secure more favorable PPAs because buyers value the dispatchable, shaped power profile they provide.
How Does Solar Curtailment Affect the Clean Energy Transition?
Solar curtailment directly undermines the clean energy transition by wasting zero-emission electricity, reducing the economic returns that drive renewable investment, keeping coal plants operating at minimum load rather than being displaced, and creating political risk around the credibility of clean energy targets. India's 2.3 TWh of curtailed solar in 2025 represented a missed opportunity to avoid 2.1 million tonnes of CO₂ emissions.
Perhaps the most corrosive impact of solar curtailment on the clean energy transition is its effect on coal dispatch. The sequence is perverse: peak solar hours force grid operators to hold coal plants at minimum technical load — not to switch them off. Coal plants kept spinning at minimum load to ensure grid stability in the evening are still burning fuel and emitting carbon, even as solar power above them is being thrown away. The result is that curtailment effectively prevents the coal displacement that solar was built to achieve.
In India, this dynamic was explicit in 2025. Coal still supplied approximately 75% of power generation in 2024. The coal fleet's inflexibility — its inability to ramp below 55% of rated capacity — was the direct cause of emergency curtailment. Each MWh of solar curtailed while coal plants idled at minimum load represents a double loss: the clean generation foregone, and the fossil fuel burned to keep the thermal fleet alive.
The IEA has been explicit: by 2030, variable renewables will generate almost 30% of global electricity supply, double today's level. This calls for a rapid increase in power system flexibility. Countries that do not build the flexibility infrastructure — storage, smart grids, demand response, interconnection — will find increasing shares of their renewable output wasted. The IEA projected in Renewables 2025 that the global generation forecast for 2030 was revised down by nearly 850 TWh compared to previous estimates, with curtailment growth being one of the two primary reasons.
At the national target level, curtailment creates a statistical and political distortion. Countries count installed renewable capacity toward climate pledges, but curtailed energy is generation capacity that exists on paper and contributes nothing to actual decarbonization. India's commitment to 500 GW of non-fossil capacity by 2030 — and its Panchamrit pledge at COP26 — assumes that installed capacity translates into actual clean generation. If 10–15% of solar output is routinely curtailed, those targets require correspondingly larger actual installation to achieve the same emission reduction.
Is Solar Curtailment Always Bad? The Contrarian Insight
📌 Contrarian Perspective: Curtailment as a Grid Stability Tool
Not all curtailment is pure waste. A small, predictable amount of curtailment can actually signal a healthy system — one that has built enough renewable capacity to regularly exceed demand. The IEA and CAISO both acknowledge that some curtailment is operationally necessary. The question is: at what point does it shift from a manageable operational cost to a structural problem that deters investment and delays decarbonization?
It is worth stepping back from the dominant narrative — that curtailment is unambiguously bad — and examining what it actually signals. A system that never curtails solar might simply be one that has not built enough solar capacity. Some curtailment is the natural by-product of having surplus generation, which is precisely the condition needed to reliably meet demand during low-solar periods. The IEA noted that "some level of curtailment is present in most systems with high solar and wind penetration — typically up to 3% of annual solar and wind output."
Grid stability — maintaining frequency within tight bands (49.90 Hz to 50.05 Hz in India's case) — is a genuine engineering requirement. Solar inverters can destabilize grid frequency if too much generation floods the system too quickly. POSOCO's forensic analysis of Tamil Nadu's curtailment events found that only about 5% of curtailment blocks were triggered by frequency exceedances outside the safe operational band. The majority were not strictly safety-driven — pointing to operational and institutional failures rather than genuine grid necessity.
There is also a market-design argument. Periods of negative pricing, driven by solar surplus, send a genuine market signal: storage is economically valuable here. They are creating investment incentives for battery storage, demand response aggregators, and green hydrogen electrolysers.
California's CAISO has explicitly pointed to excess midday solar as the business case driving its battery storage boom. The 45% growth in CAISO battery capacity in 2024 was, in part, a market response to curtailment opportunity. Germany's green hydrogen and power-to-heat sector is being explicitly designed to absorb surplus solar during negative-price hours.
However, there is a clear inflection point between useful flexibility signal and damaging structural loss. When curtailment reaches 10–18% of monthly solar generation, as India experienced in October 2025, it is no longer a market signal. It is a system failure.
When it destroys PPA economics, deters investors, and keeps coal plants burning unnecessary fuel, it is working against the transition rather than managing it. The goal is not zero curtailment — it is predictable, compensated, and declining curtailment within a system that is genuinely becoming more flexible over time.
What Are the Best Solutions to the Solar Curtailment Problem?
There is no single fix. Grid operators, policy makers, technology developers, and demand-side participants all have roles to play. The solutions that are actually working — at scale, with documented results — fall into three categories.
Battery Storage (BESS) & Long-Duration Energy Storage
Battery Energy Storage Systems (BESS) are currently the most scalable short-duration solution to solar curtailment. Global battery storage deployments increased 53% in 2024, with 205 GWh installed globally. Costs dropped approximately 40% to USD 165/kWh in 2024, making storage-paired renewable projects increasingly viable. CAISO's battery capacity grew 45% in 2024 alone to 11.6 GW, directly reducing curtailment by absorbing midday solar surplus for evening discharge.
The chemistry of modern utility-scale battery storage is dominated by Lithium Iron Phosphate (LFP) cells, which offer a superior cycle life, thermal stability, and lower fire risk compared to earlier NMC (Nickel Manganese Cobalt) chemistries. An LFP cell can sustain 3,000–6,000 full charge-discharge cycles with minimal capacity degradation — essential for systems that cycle daily in response to solar generation profiles. At the pack level, current utility-scale BESS systems operate at round-trip efficiencies of 85–92%, meaning roughly 88 cents of every dollar's worth of electricity stored is recovered on discharge.
The scale of deployment is genuinely impressive. China surpassed 78 GW of cumulative battery storage at end-2024, with batteries overtaking pumped hydro as the country's largest storage asset class. By mid-2025, China's battery storage capacity had climbed to 95 GW — a 69% year-on-year increase. The IEA projects global cumulative installed battery storage will need to reach 1,500 GW by 2030 — a roughly sixfold increase from today.
Short-duration batteries (2–4 hours) are effective at managing the daily Duck Curve cycle. But they are insufficient for multi-day cloudy periods or seasonal mismatches. This is where long-duration energy storage (LDES) becomes critical. Technologies in various stages of commercial deployment include flow batteries (vanadium redox, iron-air), compressed air energy storage (CAES), gravity-based storage, and pumped hydro. Pumped hydro still represents the vast majority of global storage capacity, at over 1,700 GW worldwide, but faces geographic constraints. India is fast-tracking pumped storage hydro permitting — a key recognition that BESS alone will not solve its seasonal and grid-security challenges.
The co-location of BESS with utility-scale solar — creating hybrid PV+BESS plants — has become commercially standard in markets where curtailment risk is high. These plants can absorb their own excess generation during midday, shift it to evening peak hours, and also provide ancillary services (frequency regulation, voltage support) that earn additional revenue streams. From a developer's perspective, the hybrid model improves PPA competitiveness, secures better debt terms, and substantially reduces curtailment exposure.
Smart Grids & AI-Driven Forecasting
Storage solves the where-to-put-the-electrons problem. Smart grids and AI solve the when to move them, and where problem. Real-time grid management at the scale of modern power systems — balancing hundreds of generators, thousands of distribution nodes, and millions of variable loads — requires computational sophistication far beyond what human operators or traditional SCADA systems can provide.
AI-driven generation forecasting works by combining satellite imagery (for solar irradiance prediction), weather model ensembles (for temperature and cloud cover), and historical generation patterns to predict solar output at the site level with 24–72 hour lead times. This forecast horizon allows grid operators to pre-position flexible resources — scheduling gas peaker plants to start or stop, activating demand response programs, adjusting hydropower dispatch, and pre-charging batteries — well before the generation event occurs. The difference between knowing a curtailment event is coming 48 hours in advance versus 10 minutes in advance is the difference between having options and having none.
Modern AI systems go further than point forecasting. They use reinforcement learning algorithms to continuously optimize dispatch decisions across the entire grid portfolio — learning from past operational patterns, market prices, and reliability events to improve future decisions. Companies such as DeepMind (in partnership with Google's data center operations) demonstrated that AI-based cooling optimization in data centers achieved 40% reductions in cooling energy consumption — the same class of optimization applied to grid operations shows comparable promise.
CAISO is investing heavily in AI-assisted curtailment forecasting and reduction. The Extended Day-Ahead Market (EDAM), expected to become operational by May 2026, will allow CAISO to sell excess solar energy to a broader regional market a day in advance — reducing the need for curtailment by increasing the pool of potential buyers.
By 2030, projections suggest AI systems could reduce curtailment by 30–40% through improved forecasting and automated demand response coordination.
In India, the push for smart metering is directly linked to curtailment reduction. Smart meters enable time-of-day tariffs that incentivize industrial and commercial consumers to shift their demand to midday hours — when solar is abundant and curtailment risk is highest.
The Indian government has proposed mandating on-site weather monitoring systems at large solar installations, which would improve local irradiance forecasting and scheduling accuracy. This is a relatively low-cost intervention with potentially significant curtailment reduction benefits.
Grid-forming inverter technology represents another AI-adjacent frontier. Modern solar inverters can be programmed not just to export power but to actively participate in grid frequency and voltage regulation — providing some of the synthetic inertia that coal and gas plants naturally supply through their rotating masses. As variable renewables displace thermal plants, maintaining grid stability requires these inverter-based services. CAISO is explicitly supporting the development of such capabilities in its renewable integration roadmap.
Demand-Side Response (EVs and Industrial Load Shifting)
The most underutilized lever in the curtailment toolkit is also perhaps the most elegant: instead of curtailing solar to fit demand, reshape demand to fit solar. Demand-Side Response (DSR) refers to programs and technologies that shift electricity consumption in time, moving loads from periods of scarcity (evening peak) to periods of surplus (midday solar peak).
Electric vehicles (EVs) represent a massive and growing demand-side flexibility resource. A typical EV battery holds 50–100 kWh of storage capacity. An EV plugged in at a factory, office park, or charging depot during work hours can absorb midday solar surplus at no additional hardware cost. If smart charging is enabled — where chargers respond automatically to grid price signals — a fleet of 1,000 EVs could absorb roughly 50–100 MWh of midday solar that might otherwise have been curtailed.
Vehicle-to-Grid (V2G) technology extends this further: EVs not only absorb midday solar, they can discharge back to the grid during evening peak hours — turning the Duck Curve's neck into a manageable ramp. Commercial V2G deployments are now operating in Japan, the Netherlands, and parts of the UK.
For India and China, where EV adoption is growing at extraordinary rates, the V2G opportunity is enormous — though it requires smart metering, bidirectional chargers, and enabling tariff structures that do not yet exist at scale.
Industrial demand response goes further. Energy-intensive industries — steel mills, aluminum smelters, cement plants, data centers, green hydrogen electrolysers — can shift significant proportions of their load to midday solar hours if price structures incentivize it. In China, new rules introduced in 2025 explicitly allow direct grid-bypass connections between renewable power plants and large industrial consumers with storage, aiming to better align supply and demand.
Data centers, which alone account for a growing share of global electricity consumption, are increasingly being located in western provinces of China near renewable resources.
"Data centers can be built almost anywhere because they only need internet connectivity," noted one energy analyst — and increasingly, they are moving to where the cheap renewable power is.
Green hydrogen electrolysis is another purpose-built demand-side flexibility asset. Electrolysers can ramp up and down quickly, consuming excess solar electricity during curtailment hours to produce hydrogen that can be stored and used later. Germany's "use instead of curtail" policy, launched in October 2024, explicitly incentivizes electrolysers and power-to-heat plants located near wind farms and solar installations to absorb surplus generation rather than forcing curtailment. This represents a policy architecture shift: instead of grid operators curtailing supply to match demand, demand is being mobilized to meet supply.
Future of Renewable Energy Curtailment: Will It Increase or Decrease?
Curtailment will increase in the short term as solar deployment outpaces grid upgrades, but is expected to stabilize and decline in the medium term if HVDC transmission, battery storage, and market reforms advance at pace. The IEA projects China's curtailment to stabilize at 5–6% thanks to expanding HVDC infrastructure and battery storage. Markets that fail to invest in flexibility will face curtailment rates well above this range, undermining both investment returns and climate targets.
The trajectory of curtailment over the next five years will be determined primarily by the race between two forces: the growth of solar PV capacity (driven by falling costs, strong policy, and corporate demand) versus the growth of grid flexibility (driven by storage investment, transmission permitting, smart grid deployment, and demand-side programs).
Right now, solar is winning that race — by a significant margin. The IEA revised its global renewable generation forecast for 2030 down by nearly 850 TWh from previous estimates, with curtailment growth being one of the two primary drivers of that revision. Solar and wind penetration will reach close to 70% in countries such as Chile, Germany, the Netherlands and Portugal by 2030, creating operational environments that no grid in history has navigated before.
Some markets are responding effectively. California's battery boom — 13 GW by early 2025, compared to virtually zero a decade earlier — is a direct response to curtailment market signals. Germany's policy reforms, China's HVDC buildout, and India's push for pumped storage all represent structural improvements that will reduce curtailment over time. The IEA's Renewables 2025 report notes that market reforms requiring wind and solar plants to participate in wholesale markets should improve dispatch efficiency and limit curtailment growth.
But the pace of grid investment globally still lags demand. U.S. utilities are projected to spend USD 84.9 billion on transmission and distribution in 2025, up USD 12 billion from 2024 — and still roughly 26,000 miles of new transmission lines are in various stages of planning and development. Yet the pace of renewable interconnection requests has been growing faster than the transmission pipeline. In 2024, four of the seven U.S. ISO/RTOs set annual records for curtailed renewable energy. In 2025, multiple of those records were already being broken again.
The fundamental conclusion of the Green Fuel Journal Research Team is this: the solar curtailment problem will not solve itself. Markets that treat it as an engineering externality rather than a policy priority will see curtailment rates accelerate, investment returns erode, and coal displacement stall. Markets that treat it as the central grid integration challenge — and deploy storage, transmission, AI forecasting, and demand flexibility as integrated solutions — will see clean energy transition timelines accelerate. The technology exists. The economics are improving rapidly.
What is often missing is the policy coordination and regulatory environment to make all the pieces work together at the speed the climate requires.
Frequently Asked Questions (FAQs)
Q1: What is solar curtailment in simple terms?
Solar curtailment means deliberately switching off or reducing the output of solar panels even when they are capable of generating electricity. This happens when the power grid cannot safely absorb more electricity — because lines are full, demand is low, or other generators cannot reduce their output fast enough to make room. It is essentially wasting clean energy for operational or infrastructure reasons.
Q2: How much solar energy does India waste due to curtailment?
According to Ember's January 2026 report, India curtailed 2.3 TWh of solar energy between May and December 2025 due to grid security reasons. This represents approximately 18% of the average monthly solar generation of 13 TWh during that period. India also experiences a larger, separate volume of transmission-constrained curtailment that is not fully compensated financially. Compensation payments for the documented emergency curtailment alone came to USD 63–76 million.
Q3: What is the Duck Curve, and how is it related to solar curtailment?
The Duck Curve is a graph of electricity demand over a 24-hour period in systems with high solar penetration. During midday, solar generation is high and net demand (total demand minus solar output) drops sharply — creating the duck's belly. In the evening, solar drops off but demand peaks — creating the duck's neck, a steep ramp that gas plants must fill. The belly is where curtailment is most likely to occur, because demand is low and solar output high. CAISO identified and named this phenomenon in 2013; it has been deepening ever since as solar capacity grows.
Q4: Why does California (CAISO) have so much solar curtailment?
California's curtailment stems from three interacting factors: rapid solar capacity growth (9.7 GW in 2014 to 28.2 GW by end-2024), transmission congestion as generation outpaces grid upgrades, and the Duck Curve dynamic that concentrates solar surplus in spring midday hours when demand is low. In 2024, CAISO curtailed 3.4 million MWh — a 29% increase from 2023 — with solar accounting for 93% of all curtailed energy (EIA). Battery storage growth (45% in 2024 alone) is helping, but has not yet fully resolved the spring surplus challenge.
Q5: What are negative electricity prices, and are they related to curtailment?
Negative electricity prices occur when electricity supply exceeds demand at a given moment and generators must pay to inject power onto the grid. They are closely linked to curtailment — both signal a mismatch between solar generation and grid absorption capacity. Germany recorded 457 hours of negative electricity prices in 2024, nearly all coinciding with peak solar generation. In 2025, Germany passed a law ending compensation for new solar plants during negative pricing hours, forcing operators to invest in storage or curtail voluntarily.
Q6: Can battery storage eliminate solar curtailment?
Battery storage can significantly reduce short-duration curtailment caused by the daily Duck Curve. CAISO's battery capacity growth (from 500 MW in 2020 to 13 GW by early 2025) directly reduced curtailment by absorbing midday solar surplus. However, batteries alone cannot solve curtailment driven by multi-day weather events, transmission congestion, or seasonal supply-demand mismatches. Long-duration storage, smart grids, demand response, and transmission investment are all needed alongside BESS. The IEA projects cumulative global battery storage needs to reach 1,500 GW by 2030.
Q7: How does curtailment affect solar project investors and PPAs?
Curtailment reduces actual electricity generation below contracted PPA levels, directly impairing revenue and Debt Service Coverage Ratios. Projects with chronic 10% curtailment can see project returns fall by 15–25%, per industry estimates. This makes financing more expensive, raises PPA prices, and deters new investment. Corporate PPA deal volumes fell 10% in 2025, with negative power prices (directly linked to solar oversupply) cited as a key driver.
Q8: What is India doing to fix its solar curtailment problem?
India's strategy for reducing curtailment focuses on three areas identified by Ember in 2026: flexible coal operations (deeper ramping capability below the current 55% minimum technical load), battery storage deployment (accelerating BESS co-location with solar projects), and demand-side response (faster smart metering rollout to enable time-of-day tariffs). India is also fast-tracking pumped storage hydro permitting for long-duration flexibility. Transmission expansion remains the single largest challenge at the national level.
Conclusion: The Flexibility Imperative
Solar curtailment is no longer a fringe concern for grid engineers — it is now a defining challenge of the energy transition. It is the point where the extraordinary success of solar PV cost reduction and deployment meets the structural constraints of power grids designed for a different era. The message from India, California, Germany, and China is consistent: you can build all the solar panels in the world, but if the grid cannot absorb the electricity, the climate benefit is wasted.
What makes the curtailment problem particularly frustrating is that it is largely solvable. We already know what works: battery storage, transmission investment, AI-driven forecasting, demand-side flexibility, smart grids, and market reforms that align prices with the physical reality of power flows. None of these solutions are experimental. They are being deployed right now, in markets that took the problem seriously early enough to act.
The Green Fuel Journal Research Team observes one consistent pattern across every market we studied: the countries reducing curtailment are not necessarily the ones with the most advanced technology — they are the ones with the clearest policy frameworks, the most predictable investment environments, and the strongest coordination between grid operators, regulators, and market participants. Technology follows policy. Capital follows certainty.
India's 2025 curtailment events were an early warning system for a country adding 38 GW of solar per year and targeting 500 GW of non-fossil capacity by 2030. They were, in Ember's words, "a real-world stress test for a high-solar future." The test revealed a fundamental reality: clean energy scales only when flexibility scales alongside it.
For energy professionals, policy analysts, and sustainability leaders — the people who will make the decisions that determine whether the energy transition succeeds — the solar curtailment problem is not a reason for pessimism. It is a precise, measurable, technically solvable engineering and policy challenge.
The question is not whether solutions exist. The question is whether the institutional will to deploy them at the speed and scale the climate demands can be summoned in time.
Based on the trajectory of battery costs, AI capabilities, and smart grid deployment, the answer should be yes — provided that the hard infrastructure and policy decisions are made now, not after the problem compounds further.
📚 References & Further Reading
This article is backed by authoritative sources and research. All citations are verified links to primary sources — government agencies, peer-reviewed research, and internationally recognized energy institutions.
International Energy Agency (IEA). Renewables 2025: Analysis and Forecast to 2030. IEA, Paris. https://www.iea.org/reports/renewables-2025
International Energy Agency (IEA). Renewables 2024: Analysis and Forecast to 2030. IEA, Paris. https://www.iea.org/reports/renewables-2024
International Energy Agency (IEA). Renewables Integration in India. IEA, Paris, 2021. https://www.iea.org/reports/renewables-integration-in-india
Ember Energy. India Lost 2.3 TWh of Solar Generation Due to Grid Security Concerns. January 27, 2026. https://ember-energy.org
Ember Energy. Forging Ahead: China Energy Transition Review 2025. December 2025. https://ember-energy.org
Ember Energy. Navigating Risks to Unlock 500GW of Renewables by 2030. February 2025. https://ember-energy.org
U.S. Energy Information Administration (EIA). Solar and Wind Power Curtailments Are Increasing in California. May 2025. https://www.eia.gov/todayinenergy/detail.php?id=65364
U.S. Energy Information Administration (EIA). As Solar Capacity Grows, Duck Curves Are Getting Deeper in California. December 2023. https://www.eia.gov/todayinenergy/detail.php?id=61103
California Independent System Operator (CAISO). Managing the Evolving Grid: Production and Curtailments Data. https://www.caiso.com/about/our-business/managing-the-evolving-grid
Germany Federal Network Agency (Bundesnetzagentur). Germany's Needs and Costs for Grid Management in 2024. Reported via Clean Energy Wire, April 2025. https://www.cleanenergywire.org
Strategic Energy Europe. Solar Curtailment Surges 97% in Germany in 2024. April 2025. https://strategicenergy.eu/solar-curtailment-germany/
PV Magazine. Germany Records 457 Hours of Negative Electricity Prices in 2024. January 2025. https://www.pv-magazine.com
PV Tech. Germany Passes Law to Curb PV Generation Surpluses and Negative Pricing. February 2025. https://www.pv-tech.org
China National Energy Administration (NEA). Chinese PV Industry Brief: Solar Curtailment Data 2024. Reported via PV Magazine, July 2024. https://www.pv-magazine.com
IEA-PVPS. Snapshot of Global PV Markets 2025. IEA Photovoltaic Power Systems Programme. https://iea-pvps.org/snapshot-reports/snapshot-2025/
IEA-PVPS. National Survey Report of PV Power Applications in China 2024. October 2025. https://iea-pvps.org/national_survey/nsr-china-2024/
Bloomberg. India Curtails More Solar Power as Grid Grapples With Oversupply. November 10, 2025. https://www.bloomberg.com
Utility Dive. California's Solar, Wind Curtailment Jumped 29% in 2024: EIA. May 2025. https://www.utilitydive.com
Argus Media. Solar Curtailment Highlights India's Grid Gaps: Ember. January 27, 2026. https://www.argusmedia.com
Saur Energy International. India Lost 2.3 TWh of Solar Generation Due to Curtailment. January 2026. https://www.saurenergy.com
POSOCO (Power System Operation Corporation). RE Curtailments Data Portal. https://posoco.in/en/re-curtailments/
Mercom India. Solar Projects with ₹7.01/kWh Tariff Face Higher Curtailment in Tamil Nadu: POSOCO. September 2021. https://www.mercomindia.com
Gridstatus.io. In CAISO, Solar Generation Jumps Again While Batteries Reshape Demand. September 2025. https://blog.gridstatus.io
Yes Energy. The Duck Curve Explained: Impacts, Renewable Energy Curtailments, and Market Strategies. June 2025. https://www.yesenergy.com
Amperon. US Solar and Wind Curtailment Is Exploding. February 2026. https://www.amperon.co
ScienceDirect. Energy and Economic Implications of Photovoltaic Curtailment: Current Status and Future Scenarios. June 2025. https://www.sciencedirect.com
Clean Energy Wire. Curtailing of Renewable Power Increases in Germany in 2023. https://www.cleanenergywire.org
Enerdata. China Installs Record Capacity for Solar (+45%) and Wind (+18%) in 2024. February 2025. https://www.enerdata.net
CKGSB Knowledge. China's Power Grid Challenges. January 2026. https://english.ckgsb.edu.cn
BloombergNEF / PV Magazine. Corporate PPA Deals Down 10% in 2025 as AI Demand Plugs Gaps. February 2026. https://www.pv-magazine.com
Energy Charts / Fraunhofer ISE. Electricity Generation in Germany in 2025. Prof. Dr. Bruno Burger. https://www.energy-charts.info
NITI Aayog. Report on India's Renewable Electricity Roadmap 2030: Towards Accelerated Renewable Electricity Deployment. 2025. https://niti.gov.in
Wikipedia / CAISO. Duck Curve. https://en.wikipedia.org/wiki/Duck_curve
PV Tech. Solar to Account for 80% of Global Renewable Capacity Additions. October 2024. https://www.pv-tech.org
Disclaimer:
The information presented in this article is for educational and research purposes only. While the Green Fuel Journal Research Team has taken every effort to ensure accuracy using authoritative sources, this content does not constitute investment, legal, or regulatory advice. Energy markets, policy frameworks, and technical data change frequently. For full terms, please visit greenfueljournal.com/disclaimers.
© 2026 GreenFuel Journal


Comments