


Green Molecules Economy 2035: Where Green Hydrogen, Ammonia, Methanol and SAF Win the Industrial Energy Transition

Green Fuel Journal Research & Intelligence Team

1. Executive Intelligence Synthesis
What is the Green Molecules Economy and why does it matter? The Green Molecules Economy is not converging on a single fuel. Global hydrogen demand reached nearly 100 Mt in 2024, backed by 66 national hydrogen strategies and more than US$41 billion in public funding — yet legislated demand of ~6 Mt/year by 2030 lags production targets of 27–33 Mt/year by a factor of four to five. Green hydrogen, green ammonia, green methanol, and SAF serve distinct industrial applications. Investors who treat this as a single-molecule race will misallocate capital. |
Five conclusions shape every section that follows. Each is data-backed and carries a direct decision implication.
Executive Signal 1 — Multiple winning molecules, not one dominant fuel
|
Executive Signal 2 — Industrial demand creation is the rate-limiting variable, not production capacity
|
Executive Signal 3 — Regional policy architecture shapes trade flows more than production cost alone
|
Executive Signal 4 — Infrastructure decisions before 2030 determine competitiveness through 2050
|
Executive Signal 5 — Cost reduction is slower than expected, and China is the outlier
|

2. Macro Context & Strategic Drivers
Why is the Green Molecules Economy emerging now? Industrial demand creation — not production scale-up — has become the decisive variable. Governments across 66 countries have committed more than US$41 billion in public hydrogen funding, but legislated demand of ~6 Mt/year by 2030 lags production targets of 27–33 Mt/year by a factor of four to five. Energy security disruptions — confirmed by the IEA's June 2026 Middle East supply-chain report — are accelerating demand for domestically produced green molecules, while mandatory EU legislation and China's manufacturing expansion are reshaping competitive dynamics simultaneously. |
Global Energy Transition Drivers
FINDING: Hard-to-abate industrial sectors — steel, fertilisers, refining, chemicals, long-haul shipping and aviation — cannot decarbonise through direct electrification alone, creating structural demand for energy-dense combustible molecules.
SO WHAT: Technology-procurement decisions across these sectors in the 2026–2030 window will lock in molecular fuel preferences for decades.
NOW WHAT: Molecule suppliers should prioritise offtake negotiations with steel producers, fertiliser manufacturers and chemical companies — not wait for aviation or shipping mandates to create demand.
Three structural forces are simultaneously active. Net-zero commitments across G20 economies are translating into sector-specific fuel mandates. Energy security concerns — made acute by the IEA's June 2026 report on Middle East supply-chain vulnerabilities — are accelerating demand for domestically produced or allied-nation green molecules. Advancing electrolyser manufacturing, particularly in China, is exerting downward pressure on production costs in a way that may support export arbitrage opportunities even as Western cost curves remain elevated.
For analysis of how grid infrastructure shapes renewable-based fuel production, see GFJ's Renewable Energy Grid Bottlenecks 2026 (greenfueljournal.com/post/renewable-energy-grid-bottlenecks-2026).
Policy Momentum
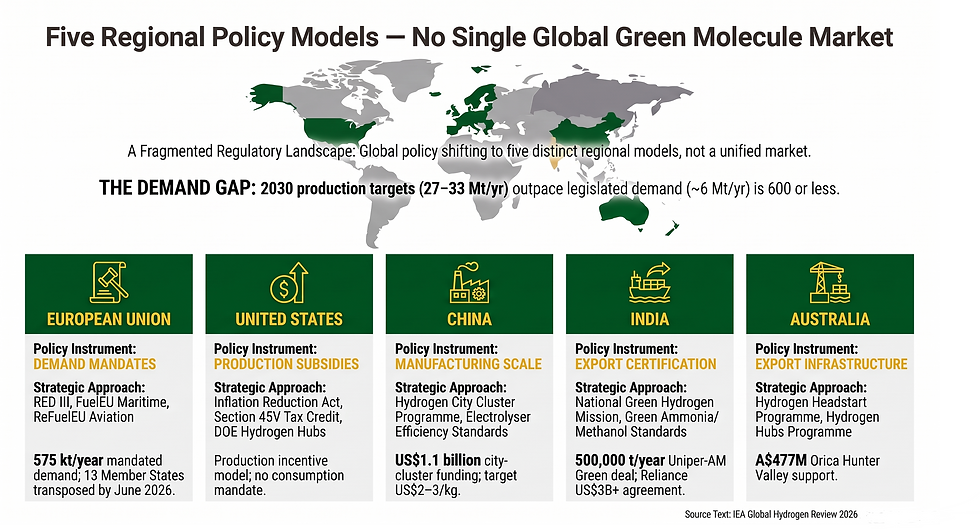
FINDING: Five major regions have adopted fundamentally different policy instruments — demand mandates (EU), production subsidies (US), manufacturing scale (China), export standardisation (India), and infrastructure investment (Australia) — meaning the global Green Molecules market is not one market but five distinct regulatory ecosystems.
SO WHAT: A molecule produced to comply with EU RFNBO (Renewable Fuel of Non-Biological Origin) Delegated Acts may not be certifiable under US Section 45V criteria, or accepted under India's Green Hydrogen Certification Scheme without additional documentation — creating trade friction that directly affects project economics.
NOW WHAT: Project developers targeting multi-region offtake must build certification compliance into the project design phase, not the financing phase.
The EU is pursuing demand creation through legislation rather than voluntary incentives. By early June 2026, 13 EU Member States had completed RED III transposition for the transport sector, creating mandatory demand for more than 575 kt/year of low-emissions hydrogen. FuelEU Maritime and ReFuelEU Aviation are adding additional demand vectors.
The European Commission has also proposed low-emissions steel procurement quotas — extending hydrogen demand creation into heavy industry. The EU's approach is the most legally binding of any region and will set the de facto international certification standard for molecules entering European ports.
The United States continues to rely on the Inflation Reduction Act's Section 45V Clean Hydrogen Production Tax Credit as its primary instrument, alongside the DOE Regional Hydrogen Hub Programme. The US model reduces production cost rather than mandating consumption — an approach that stimulates supply without guaranteeing demand.
China has introduced a US$1.1 billion hydrogen city-cluster programme, established end-use price targets of approximately US$2–3/kg, and adopted new electrolyser efficiency standards while broadening hydrogen applications beyond transport. China is the world's largest electrolyser producer and is now transitioning from equipment export to molecule export. India and Australia are discussed in dedicated sections below.
Market Fundamentals
FINDING: Global hydrogen demand reached nearly 100 Mt in 2024, but low-emissions hydrogen — including green, blue and pink — represents less than 1% of that total, while government demand targets reach only 9.5 Mt/year and production targets reach 27–33 Mt/year against legislated demand of ~6 Mt/year by 2030.
SO WHAT: The gap between production ambition and contracted demand is the single most important commercial risk in the green molecule market — it directly threatens project bankability and investor returns before 2030.
NOW WHAT: Investors must discount announced production capacity by the ratio of contracted to uncontracted demand when evaluating project valuations in this sector.
Trade is emerging as a structural demand driver. The IEA notes that
"Trade remains a key driver of low-emissions hydrogen projects"
(IEA, Global Hydrogen Review 2026).
Export-oriented agreements — particularly in green ammonia — are the strongest source of contracted demand for green molecule projects, reinforcing the importance of bilateral trade infrastructure in determining which production projects achieve FID.
For GFJ's analysis of hydrogen production economics, see Green Hydrogen Cost Economics 2026 (greenfueljournal.com/post/green-hydrogen-cost-economics-2026-the-real-path-to-price-parity).
3. India-Specific Analysis
Why is India emerging as a global green molecule exporter? India's National Green Hydrogen Mission (NGHM) is export-oriented by design, not import-substitution oriented. On 7 March 2026, MNRE formally announced standards for green ammonia and green methanol — enabling certified export to Japan, South Korea, and the EU. In January 2026, Uniper signed a binding agreement to import up to 500,000 tonnes/year from AM Green from 2028. India faces real constraints in water availability, electrolyser supply chains, and infrastructure maturity that could delay commercial scale. |
National Green Hydrogen Mission — Objectives and Incentives
FINDING: India's NGHM targets are structured around domestic green hydrogen production, green ammonia export, and green methanol export — extending beyond hydrogen gas into the derivative molecules that are commercially easier to transport at scale.
SO WHAT: This derivatives-first strategy aligns with the infrastructure reality that liquid carrier molecules — ammonia and methanol — can be transported through existing chemical shipping infrastructure without requiring new dedicated hydrogen pipelines.
NOW WHAT: Companies evaluating India as a green molecule source should assess ammonia and methanol certification readiness — not only hydrogen production capacity — as the near-term commercial gateway.
On 7 March 2026, India's Ministry of New and Renewable Energy (MNRE) formally announced standards for both green ammonia and green methanol — formalising certified standards for hydrogen derivatives and enabling Indian producers to provide internationally recognised certification to European and Asian buyers.
The official MNRE statement:
"Government announces standards of Green Ammonia and Green Methanol for India to accelerate trade of Green Hydrogen derivatives."
(MNRE, Official Press Release, 7 March 2026).
These standards are a prerequisite for accessing regulated import markets in Japan, South Korea, and the EU.
For context on India's renewable energy supply-side infrastructure, see GFJ's Khavda Solar Park and India's Renewable Industrial Operating System (greenfueljournal.com/post/khavda-solar-park-and-the-rise-of-india-s-renewable-industrial-operating-system).
Green Ammonia and Green Methanol — Certification and Export Readiness
FINDING: India has formalised a Green Hydrogen Certification Scheme alongside its Green Ammonia Standard and Green Methanol Standard — creating a three-layer certification architecture that addresses both domestic regulation and international trade requirements simultaneously.
SO WHAT: Certification architecture at this level of specificity reduces buyer due-diligence costs and accelerates offtake agreement timelines, giving India a regulatory-readiness advantage over competitors without harmonised national standards.
NOW WHAT: European importers seeking diversified green ammonia supply outside Australia and the Middle East should include India in RFQ processes, subject to cross-certification validation against EU RFNBO criteria.
Demand aggregation programmes under the NGHM create a domestic anchor for production projects, reducing dependence on single offtake agreements. India's export pipeline reflects early commercial traction: on 2 July 2026, the Press Information Bureau confirmed long-term green ammonia and green methanol offtake agreements between ACME Group and Japanese buyers IHI Corporation and Mitsubishi Gas Chemical under the NGHM. In January 2026, Uniper signed a binding agreement to import up to 500,000 tonnes/year of green ammonia from AM Green, with deliveries expected from 2028. This is among the world's largest long-term green ammonia purchase agreements to date.
India's Competitive Advantages
FINDING: India's solar irradiance levels, land availability for large-scale renewable deployment, established chemical manufacturing base, and existing port infrastructure on India's western and eastern coasts create a structurally lower cost base for green derivative production than European alternatives.
SO WHAT: India can compete on delivered cost of green ammonia into European ports with Australian and Middle Eastern suppliers, particularly for buyers in Southern and Eastern Europe where shipping distances from Indian west-coast ports are competitive.
NOW WHAT: Logistics planners at industrial buyers should map delivered-cost comparisons from Indian ports against Australian and Gulf suppliers before entering long-term supply agreements.
India's existing fertiliser sector provides a ready industrial customer base for domestic green ammonia, enabling projects to de-risk through split offtake — selling a portion domestically and exporting the remainder. This dual-market structure is unavailable to pure-export producers in Australia or the Middle East, giving Indian producers a structural bankability advantage.
GFJ's Green Ammonia Exports 2027 report provides detailed competitive positioning (greenfueljournal.com/post/green-ammonia-exports-2027).
Risks and Structural Constraints
FINDING: India faces three structural constraints that its competitors do not share at comparable scale: water availability for electrolysis in high-irradiance but water-stressed regions (Rajasthan, Gujarat), dependence on imported electrolysers from China, and last-mile transmission and port infrastructure gaps that could limit export throughput before 2030.
SO WHAT: Water stress in the most solar-rich regions directly constrains electrolyser capacity deployment, potentially forcing developers to choose between optimal solar resource and adequate water access — a trade-off that adds cost and complexity not present in offshore Australian or Middle Eastern projects.
NOW WHAT: Project developers in India must conduct integrated water resource assessment at the site-selection stage, not as a permitting afterthought — and buyers should contractually require water availability certification before signing long-term offtake agreements.
BASF's strategic approach — retaining hydrogen as a chemical feedstock rather than pivoting to export — is instructive for India's industrial users. India's domestic electrolyser manufacturing capacity is developing but is not yet at the scale required to insulate NGHM projects from Chinese supply-chain dependencies. A disruption in Chinese electrolyser supply — identified as a vulnerability by the IEA's June 2026 Middle East supply-chain analysis — would delay Indian project timelines as well as global ones. This risk reinforces the case for India to accelerate its own electrolyser production incentives under the NGHM framework.
4. Operational & Technical Deep-Dive
Which green molecule creates the greatest commercial value for which industrial sector? No single green molecule dominates all sectors. Green hydrogen delivers the strongest value in refining, steel, and chemicals as a direct feedstock. Green ammonia currently offers the best economics for long-distance hydrogen transport and fertiliser production because it is liquid at ambient refrigeration temperatures. Green methanol is liquid at ambient temperature and pressure and is the leading candidate for maritime shipping. SAF is the only credible near-term decarbonisation pathway for aviation — aircraft cannot use any other green molecule at commercial scale before 2035. |
Green Hydrogen — Commercial Position
FINDING: Green hydrogen's highest-value application is as a direct industrial feedstock — in steel production via direct reduction of iron ore, in oil refining, and in ammonia and methanol synthesis — not as a transport fuel or energy carrier for power generation.
SO WHAT: Steel and refining companies that secure long-term green hydrogen supply agreements before 2030 will lock in cost and carbon-intensity advantages over competitors dependent on later-market procurement in a tighter supply environment.
NOW WHAT: Industrial buyers in steel and refining should prioritise supply-side partnerships with green hydrogen producers in low-cost renewable regions — not wait for spot market development.
Green hydrogen's primary commercial limitation is cost of transport and storage. It requires cryogenic liquefaction (at approximately -253°C — standard thermochemical reference) or high-pressure compression for long-distance transport, both adding significant cost versus liquid carriers. The IEA confirms that cost reductions have been slower than expected because of elevated electrolyser prices, inflation, and financing costs. China is the only major region approaching fossil-fuel cost parity before 2030.
For analysis of grid-scale storage that supports electrolyser operations, see GFJ's Grid Scale Energy Storage: Technologies, Economics & the Road to 1,500 GW (greenfueljournal.com/post/grid-scale-energy-storage-technologies-economics-the-road-to-1-500-gw).
Green Ammonia — Commercial Position
FINDING: Green ammonia currently offers the most cost-effective solution for international hydrogen transport over long distances — it is liquid at approximately -33°C (standard thermochemical reference) and uses existing ammonia tanker and terminal infrastructure built for the global fertiliser trade.
SO WHAT: For import-dependent regions such as Japan, South Korea, and Northern Europe, green ammonia is the most commercially viable green molecule for large-volume delivery in the 2026–2032 timeframe — before hydrogen pipeline infrastructure could realistically reach scale.
NOW WHAT: Asian industrial buyers seeking to decarbonise should prioritise green ammonia supply agreements now, while acknowledging the longer-term optionality to crack ammonia back to hydrogen or use it directly as an energy carrier in co-firing or maritime applications.
The critical unresolved strategic question is whether green ammonia will remain the dominant hydrogen carrier after 2035. Techno-economic modelling confirms that ammonia currently holds the infrastructure advantage. However, the same modelling notes that direct hydrogen pipelines become more economical for large-volume, geographically proximate supply at scale. If global announced hydrogen pipeline capacity — over 40,000 km by 2035, of which only approximately 9% has reached committed investment — develops faster than current commissioning rates suggest, the economic case for ammonia cracking shifts against ammonia-as-carrier.
Companies building ammonia import terminals before 2030 carry material stranded-asset exposure if the pipeline network accelerates post-2032. Separate peer-reviewed techno-economic research (arXiv, July 2025) confirms that a methanol-based energy system adds approximately 3% to overall system cost compared to an extensive hydrogen infrastructure — but avoids significant pipeline capital expenditure, which matters when pipeline timelines are uncertain.
Green Methanol — Commercial Position
FINDING: Green methanol is liquid at ambient temperature and pressure, chemically compatible with existing methanol storage and handling infrastructure, and is the leading green fuel candidate for the maritime sector — with dual-fuel vessels entering service that can use conventional or green methanol interchangeably.
SO WHAT: Shipping companies that invest in methanol-capable vessels now create optionality: they can operate on conventional methanol while green methanol supply scales, transitioning the carbon intensity of the same asset over time without equipment replacement.
NOW WHAT: Ship operators ordering newbuilds should evaluate methanol dual-fuel capability against LNG dual-fuel, noting that green methanol supply chains are developing faster than green ammonia bunkering infrastructure in most major ports.
Green methanol requires a sustainable carbon source — typically biogenic CO₂ or direct air capture CO₂ — in addition to green hydrogen. This carbon feedstock dependency adds cost and supply-chain complexity that ammonia does not face. The existing global methanol trade infrastructure — spanning tankers, storage terminals, and chemical plant feedstock systems — gives green methanol a logistics advantage that no other green molecule except green ammonia can match.
Sustainable Aviation Fuel (SAF) — Commercial Position
FINDING: SAF is the only near-term commercially deployable decarbonisation solution for commercial aviation — liquid hydrogen aircraft are not expected at commercial scale before 2035–2040, and electric aviation remains confined to short-haul routes below 500 km.
SO WHAT: Regulatory mandates such as ReFuelEU Aviation are creating legally guaranteed SAF demand that does not depend on airline voluntary commitments — making SAF projects more bankable than uncontracted green hydrogen production at comparable scale.
NOW WHAT: Investors evaluating the aviation decarbonisation opportunity should focus on Power-to-Liquid (PtL) SAF production pathways that use green hydrogen and captured CO₂ — as these scale with green hydrogen production cost reductions and are feedstock-flexible.
Green Molecule Decision Matrix — GFJ Proprietary Framework
Criteria | Green Hydrogen | Green Ammonia | Green Methanol | SAF |
Production Economics | High cost; China approaching parity before 2030 | Adds synthesis step; competitive at scale | Adds synthesis + carbon feedstock cost | Highest production cost of all four |
Transport Economics | Expensive; requires cryogenics or compression | Best long-distance carrier; existing tanker fleet | Ambient liquid; excellent logistics | Ambient liquid; conventional aviation supply chain |
Storage Efficiency | Low volumetric density; cryogenic or HP storage | Moderate; ~-33°C refrigerated tanks | High; ambient conditions | High; ambient conditions |
Policy Support | Strong (45V, RED III, NGHM) | Growing; export-oriented national strategies | Maritime mandates (FuelEU) | Aviation mandates (ReFuelEU); highest mandated share |
Infrastructure Maturity | Low; pipelines <9% committed | Moderate; existing ammonia terminal network | Moderate-High; existing methanol terminals | High; compatible with existing airport fuel systems |
Scalability | High potential; constrained by infrastructure | High near-term via existing trade routes | Moderate; carbon feedstock bottleneck | Moderate; feedstock competition at scale |
Investment Attractiveness | High for steel/refining; risk for generic projects | High for export-oriented producers; stranded-asset risk post-2032 | Strong for shipping and chemicals | Strong where mandates exist; cost risk without mandates |
Long-term Competitiveness | Dominant in hard-to-electrify industries | Dominant in fertilisers; contested in carrier role post-2035 | Strong in chemicals and shipping | Dominant in aviation through 2040 |

5. Named Company Case Studies
What do leading company decisions reveal about Green Molecules market logic? Reliance Industries signed a US$3 billion+ green ammonia export agreement with Samsung C&T confirming Asia's appetite for long-term contracted supply. Envision Energy is producing 320,000 tonnes/year from Chifeng, Inner Mongolia, targeting Japan, South Korea and Europe. BASF's Verbund sites confirm chemical feedstock as hydrogen's most bankable near-term demand. Orica's A$477 million Hunter Valley project demonstrates that on-site feedstock substitution eliminates offtake risk entirely. |
Reliance Industries — The Export Ammonia Thesis
Reliance Industries signed a 15-year green ammonia supply agreement with Samsung C&T (South Korea) with a contract value exceeding US$3 billion, with supply commencing in FY2029. The agreement forms part of Reliance's US$10 billion clean energy investment strategy (figure as stated by the company).
The strategic lesson is not that Reliance is building a green ammonia plant. A 15-year contracted offtake covering a supply period commencing FY2029 reveals that sophisticated corporate buyers in Asia are making long-term structural bets on imported green ammonia from India rather than waiting for domestic hydrogen production or regional pipeline connectivity. This is the demand signal that makes Indian green molecule projects bankable in ways that European projects without contracted offtake are not.
Envision Energy — China's Molecule Export Strategy
Envision Energy is operating a large-scale green ammonia production facility in Chifeng, Inner Mongolia, with current production capacity of 320,000 tonnes/year and a declared long-term target of 5 million tonnes/year — targeting export markets in Japan, South Korea, and Europe.
China is retaining some of the cheapest renewable electricity — particularly in Inner Mongolia — to produce green molecules domestically for export. If Envision Energy's cost structure at 320,000 t/year is materially below that of Indian or Australian competitors, it will set a delivered-price ceiling for the global green ammonia trade that reshapes the economics of projects under development in higher-cost regions.
BASF — Industrial Hydrogen as Feedstock, Not Fuel
BASF is one of Europe's largest industrial hydrogen users, consuming significant volumes in its Verbund integrated chemical production sites. Its investment in electrification and low-carbon hydrogen for chemical manufacturing confirms the most durable commercial thesis in this report: hydrogen's strongest near-term value proposition is as an industrial feedstock in existing chemical processes, not as a transport or power fuel.
The strategic lesson from BASF's approach is that the largest and most creditworthy industrial offtake for green hydrogen will come from chemical companies that need hydrogen as a process input — where substitution from grey hydrogen to green hydrogen is a direct carbon-accounting improvement with an assignable cost. This is a fundamentally different market dynamic from speculative demand in new transport or power applications, and should be weighted accordingly in any demand forecast model.
Orica — Import Substitution as Commercial Entry Point
Orica's Hunter Valley Green Hydrogen Project in Australia is producing approximately 12 tonnes/day of hydrogen from a 50 MW electrolyser, with A$477 million in government support through Australia's Hydrogen Headstart Programme. The hydrogen replaces natural gas feedstock used in on-site ammonia production for the mining explosives sector.
Import substitution — replacing an existing fossil gas input with green hydrogen at the same site — is a commercially cleaner entry point than building new green hydrogen demand from scratch. Orica does not need to find a new hydrogen customer, build new transport infrastructure, or create a new market. It decarbonises a process it already operates, with a government grant reducing capital risk. This model is replicable in any industrial facility currently using grey hydrogen as a feedstock or process gas.
Company | Molecule | Strategy | Investment (Verified) | Competitive Advantage | Key Lesson |
Reliance Industries | Green Ammonia | Long-term export to South Korea | US$3B+ contract; US$10B clean energy programme (company-stated) | Low renewable cost base; established chemical infrastructure | Asian buyers contracting at 15-year timescales — offtake certainty precedes scale |
Envision Energy | Green Ammonia | Export to Japan, South Korea, Europe | 320,000 t/year current; 5 Mt/year target | Low-cost renewable electricity in Inner Mongolia | China transitioning from electrolyser export to molecule export |
BASF | Green Hydrogen | Industrial feedstock decarbonisation | Not disclosed in public sources | Existing hydrogen-intensive Verbund chemical sites | Chemical feedstock is hydrogen's most bankable near-term demand |
Orica | Green Hydrogen → Ammonia | On-site feedstock substitution | A$477M government support; 50 MW electrolyser | Captive demand eliminates offtake risk | Import substitution is a lower-risk entry point than building new molecule markets |
6. Friction, Risk & Systemic Bottlenecks
What are the biggest risks facing the Green Molecules Economy in 2026–2030? The single largest systemic risk is the supply-demand imbalance: production targets of 27–33 Mt/year by 2030 exceed legislated demand of ~6 Mt/year by a factor of four to five. This gap directly threatens project bankability, delays FIDs, and creates conditions for stranded electrolyser capacity across multiple regions. Infrastructure immaturity, certification fragmentation, and financing constraints compound this primary risk. None of these are technology failures — they are market structure failures requiring policy intervention and contractual innovation. |
Infrastructure Bottlenecks
FINDING: Of the more than 40,000 km of hydrogen pipelines announced globally by 2035, only approximately 9% have reached operational status or committed investment — while underground hydrogen storage projects face similarly immature development timelines.
SO WHAT: Projects premised on hydrogen pipeline delivery before 2030 carry execution risk not reflected in current project valuations or government targets — creating a risk of systematic overstatement of addressable demand in pipeline-dependent market models.
NOW WHAT: Infrastructure investors should consider discounting announced pipeline capacity materially — given that only ~9% has reached committed investment — when modelling hydrogen transport cost scenarios, and prioritise liquid-carrier projects (ammonia, methanol) that do not depend on pipeline development timelines.
Port infrastructure for ammonia and methanol bunkering is developing faster than hydrogen pipeline networks — but remains highly concentrated in Northern European ports and Japanese terminals. New bunkering capability in Southeast Asian and Indian Ocean ports is required before shipping operators can deploy methanol or ammonia-fuelled fleets on Indian Ocean and Pacific routes.
For analysis of how grid infrastructure constraints compound across the energy system, see GFJ's Grid Enhancing Technologies (greenfueljournal.com/post/grid-enhancing-technologies-complete-report-2026).
Certification Challenges
FINDING: The EU's RFNBO Delegated Acts define renewable hydrogen with specific additionality, temporality and geographic correlation requirements that are incompatible with the simpler certification frameworks adopted by India, Australia, and some US state-level programmes.
SO WHAT: Green molecules produced to national standards outside the EU may not qualify for European mandated fuel obligations without additional compliance steps — adding cost and regulatory complexity that disproportionately affects export-oriented producers in India and Australia.
NOW WHAT: Producers targeting European markets must design their renewable energy procurement contracts to comply with EU RFNBO additionality, temporality and geographic correlation requirements from project inception, not at the permitting stage.
The absence of internationally harmonised Guarantees of Origin for green hydrogen and its derivatives means that buyers in Japan and South Korea are operating under different certification frameworks than European buyers — creating a market where the same molecule may qualify as "green" in one jurisdiction and fail to qualify in another.
Supply–Demand Imbalance
FINDING: The IEA's Global Hydrogen Review 2026 confirms that investment momentum in green hydrogen weakened during 2025 despite continued policy support — a direct consequence of the widening gap between production ambition and contracted offtake.
SO WHAT: Weakening investment momentum in 2025 is an early signal of a market correction — some announced projects will not reach FID, production targets will be revised downward, and project developers without contracted demand are already in a structurally weakened commercial position.
NOW WHAT: Project developers without binding offtake agreements should pause construction-stage spending and redirect resources to demand-side origination — securing offtake before committing to capital expenditure is the discipline that separates bankable projects from announced ones.
Financing Challenges
FINDING: Elevated financing costs since 2022 have increased the cost of capital for green molecule projects at the same time as electrolyser prices and construction inflation have increased project CAPEX — squeezing returns from both directions simultaneously.
SO WHAT: Projects modelled on pre-2022 financing assumptions require material return-on-equity revisions before they can be presented to institutional investors or development finance institutions — and many will not survive that revision.
NOW WHAT: Project sponsors should engage development finance institutions (World Bank, ADB, EBRD) for concessional debt tranches before approaching commercial lenders, using blended finance structures to bring effective cost of capital to bankable levels for the specific jurisdiction and project risk profile.
7. Capital & Investment Implications
Where should capital be allocated across the Green Molecules Economy between 2026 and 2030? Capital allocation in the Green Molecules Economy faces a fundamental dilemma: projects without contracted demand are unbankable, but demand-creation infrastructure — certification systems, port facilities, pipeline networks — requires capital commitment before large-scale offtake can be signed. The resolution is a sequenced investment strategy that prioritises demand-side origination, certification readiness, and liquid-carrier infrastructure over speculative electrolyser deployment in markets without mandated demand. |
Green Molecule Capital Allocation Framework — GFJ Proprietary
Investment Category | Priority | Rationale | Risk Level |
Contracted offtake origination | Highest | Bankability precondition for all molecule types | Low (if done first) |
Green ammonia export terminals (India, Australia, Middle East) | High | Near-term infrastructure advantage; existing tanker fleet | Medium (stranded-asset risk post-2032) |
Green methanol production (co-located with carbon feedstock) | High | Maritime mandates create guaranteed demand; ambient logistics | Medium (carbon feedstock risk) |
Electrolyser manufacturing (Asia, EU) | Medium | Cost reduction essential; Chinese dominance is competitive risk | Medium-High |
Hydrogen pipeline infrastructure | Low-Medium | Only ~9% of announced capacity committed; timeline risk high | High |
Uncontracted electrolyser deployment | Lowest | Without offtake, stranded capacity risk is structural | Very High |
Global Green Molecule Competitiveness Index
Region | Production Cost | Renewable Resource | Export Infrastructure | Policy Support | Domestic Demand | Overall Rating |
China | ★★★★★ Lowest globally | ★★★★★ | ★★★☆☆ | ★★★★☆ | ★★★★★ | Highest near-term |
Australia | ★★★★☆ | ★★★★★ | ★★★☆☆ Developing | ★★★★☆ | ★★☆☆☆ | High for export |
India | ★★★★☆ | ★★★★★ | ★★★☆☆ | ★★★★★ NGHM + standards | ★★★★☆ Fertiliser base | High and rising |
Middle East | ★★★★☆ | ★★★★★ | ★★★★☆ | ★★★☆☆ | ★★★☆☆ | Strong, cost-competitive |
European Union | ★★☆☆☆ High cost | ★★★☆☆ | ★★★★★ | ★★★★★ Strongest mandates | ★★★★★ | Best demand market; weak supply |
United States | ★★★☆☆ | ★★★★☆ | ★★★☆☆ | ★★★★☆ (45V) | ★★★★☆ | Strong domestic; limited export |
Brazil | ★★★★☆ | ★★★★★ | ★★☆☆☆ | ★★★☆☆ | ★★★☆☆ | Long-term potential; near-term gaps |
Stranded asset risk is concentrated in three infrastructure categories: ammonia import terminals built before 2030 that assume hydrogen pipeline non-delivery post-2032; electrolysers deployed without contracted offtake; and bunkering facilities in ports where maritime fuel mandates are delayed beyond current legislative timelines.
For analysis of M&A dynamics reshaping clean energy capital allocation, see GFJ's New Energy M&A Playbook 2026–2027 (greenfueljournal.com/post/new-energy-m-a-playbook-2026-2027).
Corporate buyers structuring long-term energy procurement should also reference GFJ's Corporate PPA 2027 framework (greenfueljournal.com/post/corporate-ppa-2027).
8. Future Scenarios & Forecast (2026–2035)
How will the Green Molecules Economy evolve by 2035? Three structurally distinct scenarios are plausible, each driven by different assumptions about policy implementation speed, infrastructure deployment, and cost trajectory. The Green Molecules market is unlikely to converge on a single outcome by 2035. Companies that align investment decisions with sector-specific molecular demand — rather than a universal fuel bet — will be better positioned under all three scenarios than those committed to a single molecule across all end-use applications. |
Scenario 1 — Accelerated Green Molecules Economy
FINDING: Under this scenario, RED III and equivalent mandates are fully implemented by 2027, electrolyser costs fall materially from 2026 levels by 2030, and international certification frameworks are harmonised, enabling large-scale cross-border molecule trade.
SO WHAT: Multiple green molecule markets mature simultaneously — green ammonia dominates fertilisers and long-distance hydrogen trade, green methanol leads shipping, SAF secures aviation, and direct hydrogen use grows in steel and chemicals.
NOW WHAT: Early-mover advantage is significant under this scenario — companies that sign long-term supply agreements before 2028 lock in below-market pricing as demand outstrips production in the early 2030s.
Strategic implication — Industry: Accelerate offtake agreements now. Investors: Increase allocation to production-side assets in low-cost renewable regions before 2028. Policymakers: Prioritise cross-border certification harmonisation as the highest-leverage near-term action.
Scenario 2 — Fragmented Regional Markets
FINDING: Under this scenario, regional policy divergence deepens — EU pursues demand mandates, US prioritises domestic supply, China scales manufacturing for export, and India/Australia build export-oriented production — creating four parallel green molecule markets with limited cross-regional trade.
SO WHAT: Regional supply chains become more important than global standardisation — a producer optimised for the EU market may not be competitive in the Japanese market, fragmenting what could otherwise be a single global green molecule price.
NOW WHAT: Companies should design supply chain structures with regional optionality — building contractual and logistical flexibility to redirect molecule flows as regional premiums and discounts develop.
Strategic implication — Industry: Dual-certify production to access both European and Asian markets. Investors: Weight investments toward regions with the strongest domestic demand mandates rather than lowest production costs. Policymakers: Invest in bilateral trade certification agreements to prevent market fragmentation from compounding project risk.
Scenario 3 — Infrastructure Bottleneck
FINDING: Under this scenario, hydrogen pipeline delays persist beyond 2032, certification fragmentation increases compliance costs, demand creation lags production targets by the full 4x–5x factor, and financing costs remain elevated — compressing project returns and slowing capacity build-out.
SO WHAT: Companies that committed to ammonia terminal infrastructure before 2028 face the best near-term returns — ammonia does not require new pipeline infrastructure — while hydrogen-pipeline-dependent projects face extended development timelines and revenue delays.
NOW WHAT: Prioritise molecules and supply chains that use existing infrastructure rather than requiring new dedicated networks — the lowest-risk strategy across all three scenarios.
Industry Forecast — Likely Leading Molecule by 2035
Industry | Likely Leading Molecule by 2035 | Confidence | Key Driver |
Steel (direct reduction) | Green Hydrogen | High | Only viable feedstock for DRI-EAF process |
Fertilisers | Green Ammonia | High | Ammonia is the feedstock; no conversion required |
Chemicals | Green Hydrogen / Green Methanol | Medium | Depends on process type; both have roles |
Maritime shipping | Green Methanol / Green Ammonia | Medium | Fleet investment decisions and bunkering availability |
Aviation | SAF | High | No alternative deployable at commercial scale by 2035 |
Oil refining | Green Hydrogen | High | Direct feedstock substitution for grey hydrogen |
Power (selected) | Green Hydrogen / Green Ammonia | Low-Medium | Co-firing and peaking roles; economics remain challenging |
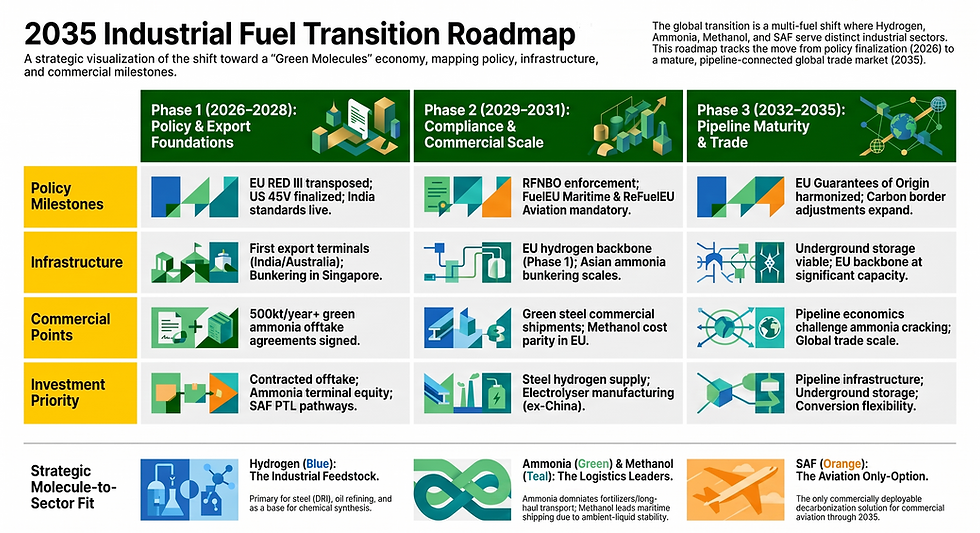
2035 Industrial Fuel Transition Roadmap — GFJ Proprietary
Period | Policy Milestones | Infrastructure Build-out | Commercial Tipping Points | Investment Priorities |
2026–2028 | EU RED III fully transposed; 45V guidance finalised; NGHM Phase 1 incentives disbursed; India Green Ammonia/Methanol standards in market | First large-scale green ammonia export terminals (India, Australia); methanol bunkering in ARA and Singapore | First binding green ammonia offtake agreements at 500,000 t/year+ scale; SAF mandate compliance triggers airline procurement | Contracted offtake origination; ammonia export terminal equity; SAF production from PtL pathways |
2029–2031 | EU RFNBO additionality rules at full enforcement; FuelEU Maritime initial compliance; ReFuelEU Aviation SAF blending mandatory | Hydrogen backbone pipeline first sections operational in EU; ammonia bunkering in Asian ports scaling | Green steel first commercial shipments; green methanol crosses cost parity for maritime applications in compliance markets | Steel-sector hydrogen supply agreements; maritime methanol production co-located with captured CO₂; electrolyser manufacturing outside China |
2032–2035 | EU Guarantees of Origin harmonised with key trading partners; carbon border adjustments extend to green molecule imports in select sectors | EU hydrogen backbone at significant operational capacity; underground hydrogen storage viable in salt cavern regions | Direct hydrogen pipeline economics begin to challenge ammonia cracking in short-to-medium corridors; green molecule cross-border trade reaches commercial scale across multiple corridors | Pipeline infrastructure; underground storage; molecule conversion flexibility (ammonia cracking + direct H₂ receipt) |
9. Strategic Recommendations
What should executives do in the next 12–24 months? The decision that matters most right now is not which molecule to back — it is whether to commit capital before offtake is contracted. Every capital commitment ahead of contracted demand is a speculative bet in a market where the supply-demand imbalance exceeds a factor of four. Executives who prioritise demand-side origination over production-side deployment will create bankable assets. Those who do not will create announced projects. |
Recommendations for Industry
Conduct a molecule-by-sector audit. Map each production process currently consuming fossil fuels against the four green molecules to identify which substitution offers the lowest cost and complexity per tonne of CO₂ avoided. The answer is almost always hydrogen-as-feedstock before hydrogen-as-fuel. Prioritise hydrogen supply contracts for refining and chemical processes before pursuing transport or power applications. Require RFNBO-compliant procurement specifications in all new supply contracts with European exposure. Sign 10–15-year offtake agreements with export-oriented producers in India or Australia before 2028, when competition for contracted supply will intensify as EU mandates reach enforcement.
Recommendations for Investors
Apply a strict offtake-first investment discipline. Do not commit equity capital to any green molecule production project without binding offtake covering at least 70% of nameplate capacity. Prioritise investments in green ammonia export infrastructure in India and Australia over European production assets where cost structures are materially higher. Underweight hydrogen pipeline infrastructure until at least 25% of announced capacity reaches committed investment. Overweight green methanol production assets co-located with established biogenic CO₂ sources, given maritime demand mandate certainty. Build blended finance structures using development bank concessional debt to bring effective cost of capital to bankable levels for the specific jurisdiction and project risk profile.
Recommendations for Policymakers
Shift policy spend from production subsidies to demand creation. Additional production incentives in markets where legislated demand represents only approximately ~20% of production targets are capacity-stranding tools, not bankability-enhancing ones. Prioritise bilateral certification agreements with India, Australia, and the Middle East to harmonise Guarantees of Origin before 2028. Mandate that green molecule import terminals funded by public finance include contractual flexibility for direct hydrogen receipt. Accelerate domestic electrolyser manufacturing incentives to reduce dependence on Chinese supply chains — as identified by the IEA's June 2026 supply-chain vulnerability analysis.
Recommendations for Technology Providers
Prioritise electrolyser cost reduction over capacity expansion in markets without demand mandates. The commercial constraint is not technology maturity — it is cost competitiveness against Chinese electrolyser pricing. Develop modular electrolyser systems designed for industrial site integration (refining, chemicals, steel) rather than standalone green hydrogen production, as industrial feedstock substitution is the highest-bankability near-term market. Build dual-fuel conversion capabilities into product roadmaps for maritime and industrial burner applications.
10 Questions Every Board Should Ask Before Investing in Green Molecules
1. Does this project have binding offtake covering at least 70% of nameplate capacity before we commit construction capital?
2. Is our chosen molecule certified under the regulatory framework of every target market — specifically EU RFNBO for European offtake?
3. Have we stress-tested project returns against a scenario where green hydrogen cost parity in non-Chinese markets does not arrive before 2030?
4. If we are building ammonia import terminal infrastructure, what is our contractual flexibility to pivot to direct hydrogen receipt if pipeline networks accelerate post-2032?
5. What is our exposure to Chinese electrolyser supply-chain disruption, and what is our contingency procurement plan?
6. Does our project site have adequate water availability for electrolyser operations — confirmed by independent hydrological assessment?
7. What development finance institution support have we explored to bring the effective cost of capital to bankable levels for this jurisdiction?
8. Have we verified that demand mandates in our target sector and geography are legally binding rather than voluntary?
9. What is our stranded-asset exposure if the dominant hydrogen carrier shifts from ammonia to direct pipeline delivery before 2040?
10. Executive FAQ
Which green molecule is best suited for each major industrial sector?
Green hydrogen is best in steel (direct reduction), oil refining, and chemicals where it is used directly as a feedstock. Green ammonia leads in fertilisers and is the current preferred long-distance hydrogen carrier. Green methanol is the leading candidate for maritime shipping. SAF is the only commercially deployable decarbonisation fuel for aviation before 2035 — no single molecule dominates all sectors.
Will green hydrogen replace green ammonia as a long-distance energy carrier?
Not before 2032–2035 in most corridors. Ammonia currently holds the infrastructure advantage, using existing tanker and terminal networks. Of the 40,000 km+ of hydrogen pipelines announced globally by 2035, only approximately 9% has reached committed investment. Companies building ammonia import terminals before 2030 carry stranded-asset exposure if pipelines accelerate post-2032.
Is green methanol a better option than green ammonia for the shipping sector?
Green methanol has a near-term advantage for shipping because it is ambient-liquid, compatible with existing methanol handling infrastructure, and dual-fuel methanol engines are already commercially available. Green ammonia offers better energy density and zero carbon intensity but requires more complex handling and safety protocols. Both molecules are expected to co-exist in maritime applications through 2035, with methanol leading in the near term.
Why is SAF expected to dominate aviation decarbonisation through 2035?
SAF is the only alternative aviation fuel usable in existing commercial aircraft without engine modification — it is a drop-in fuel compatible with current jet fuel infrastructure. Liquid hydrogen aircraft are not expected at commercial scale before 2035–2040, and electric aviation remains limited to routes below approximately 500 km. ReFuelEU Aviation mandates create legally binding demand that does not depend on airline voluntary commitments.
Which countries will lead global green molecule exports by 2035?
India, Australia, China, and the Middle East are the most competitive production regions. India holds a differentiated position because its domestic fertiliser sector provides captive ammonia demand, certified standards are now in place (Green Ammonia and Green Methanol Standards, March 2026), and its proximity to Asian import markets reduces offtake risk. China is the lowest-cost producer but faces trade policy uncertainty in European markets.
How should companies decide whether to produce, import or procure green molecules?
The primary decision criteria are total delivered molecule cost including transport and certification, regulatory compliance certainty in the target jurisdiction, and security of supply. Companies with existing hydrogen-consuming processes should evaluate on-site or near-site production first — import substitution eliminates offtake risk. A portfolio approach combining domestic production, long-term import contracts, and spot procurement reduces supply concentration risk.
Which infrastructure investments in the Green Molecules Economy face the highest stranded-asset risk?
Three categories face the highest stranded-asset risk: ammonia import terminals built before 2028 on the assumption that hydrogen pipelines will not reach scale before 2035; electrolysers deployed without binding offtake agreements (demand currently lags production targets by a factor of four to five); and bunkering infrastructure in ports where maritime fuel mandates are delayed or weakened after 2027.
What is the GFJ Green Molecule Decision Matrix and how should it be used?
The Green Molecule Decision Matrix is a GFJ proprietary framework ranking green hydrogen, green ammonia, green methanol, and SAF across eight criteria: production economics, transport economics, storage efficiency, policy support, infrastructure maturity, scalability, investment attractiveness, and long-term competitiveness. It is designed for capital allocation and procurement decisions at the sector and geography level — presented in full in Section 4 of this report.
Legal Disclaimer & Scope of This Report
This report is published by Green Fuel Journal, a research and publishing brand operated by Sekason Research Limited (Company No. 14339910), registered in England and Wales. It is produced for informational and strategic intelligence purposes only.
This report does not constitute legal advice, financial advice, investment advice, engineering advice, or safety certification guidance of any kind. Nothing in this report should be relied upon as the basis for any investment, procurement, regulatory compliance, or capital allocation decision without independent professional verification.
Where company-stated figures appear (including values stated by Reliance Industries, Envision Energy, and others), these are reproduced as stated by those companies or reported in cited sources and have not been independently audited by Green Fuel Journal. Where specific financial benchmarks could not be verified from authoritative public sources, this has been stated explicitly in the text.
This report does not constitute an endorsement of any company, technology, or policy instrument referenced herein. Market projections and scenario forecasts are analytical tools, not predictions.
Full disclaimers: greenfueljournal.com/disclaimers | Editorial Standards: greenfueljournal.com/editorial-standards | Research Methodology: greenfueljournal.com/research-methodology
References & Strategic Sources.
International Energy Agency (IEA) | Global Hydrogen Review 2026 | 18 June 2026 | https://www.iea.org/reports/global-hydrogen-review-2026
International Energy Agency (IEA) | Executive Summary – Global Hydrogen Review 2026 | 18 June 2026 | https://www.iea.org/reports/global-hydrogen-review-2026/executive-summary
International Energy Agency (IEA) | Policy – Global Hydrogen Review 2026 | 2026 | https://www.iea.org/reports/global-hydrogen-review-2026/policy
International Energy Agency (IEA) | Trade and Infrastructure – Global Hydrogen Review 2026 | 2026 | https://www.iea.org/reports/global-hydrogen-review-2026/trade-and-infrastructure
International Energy Agency (IEA) | Key Questions about Hydrogen | 2026 | https://www.iea.org/reports/global-hydrogen-review-2026/key-questions-about-hydrogen
International Energy Agency (IEA) | Middle East crisis exposes vulnerabilities in global hydrogen supply chains | 18 June 2026 | https://www.iea.org/news/middle-east-crisis-exposes-vulnerabilities-in-global-hydrogen-supply-chains-as-low-emissions-alternatives-struggle-to-ramp-up
Press Information Bureau (Government of India) | India Advances Global Green Hydrogen Leadership under National Green Hydrogen Mission | 2 July 2026 | https://www.pib.gov.in/PressReleasePage.aspx?PRID=2280506
Ministry of New and Renewable Energy (MNRE), Government of India | Government announces standards of Green Ammonia and Green Methanol for India | 7 March 2026 | Official Press Release
Reuters | Uniper signs long-term offtake agreement on green ammonia with India's AM Green | 12 January 2026 | https://www.reuters.com/world/india/uniper-signs-long-term-offtake-agreement-green-ammonia-with-indias-am-green-2026-01-12/
arXiv | Green Ammonia: A Techno-Economic Supply Chain Optimization | 3 July 2025
This report is backed by authoritative research, institutional analysis, industry intelligence, and strategic data sources


